Diwali Engagement Playbook is now


TL;DR
- Customer journey metrics help businesses measure how customers move through every stage of their lifecycle from awareness and acquisition to retention and advocacy.
- Unlike campaign metrics that evaluate individual marketing efforts, journey metrics reveal how well the entire customer experience performs.
- In this guide, you’ll learn the 18 most important customer journey metrics, how to track them across the customer lifecycle, and how AI-powered journey orchestration can improve engagement, conversions, and customer lifetime value.
Every marketer tracks metrics. Email open rates, click-through rates, website traffic, conversion rates the list goes on.
But here’s the challenge: customers don’t experience your brand one campaign at a time. They experience a journey.
A customer might discover your brand through social media, browse your website, abandon their cart, receive a personalized email, return through a push notification, make a purchase, and later engage with your loyalty program. Looking at each touchpoint in isolation doesn’t tell you why customers convert, drop off, or stay loyal.
That’s where customer journey metrics come in.
Rather than measuring the performance of individual channels or campaigns, customer journey metrics evaluate the effectiveness of the entire customer experience. They reveal friction points, identify opportunities for personalization, and help marketers understand which interactions drive long-term business growth.
In this guide, we’ll cover:
- What customer journey metrics are
- Why they matter
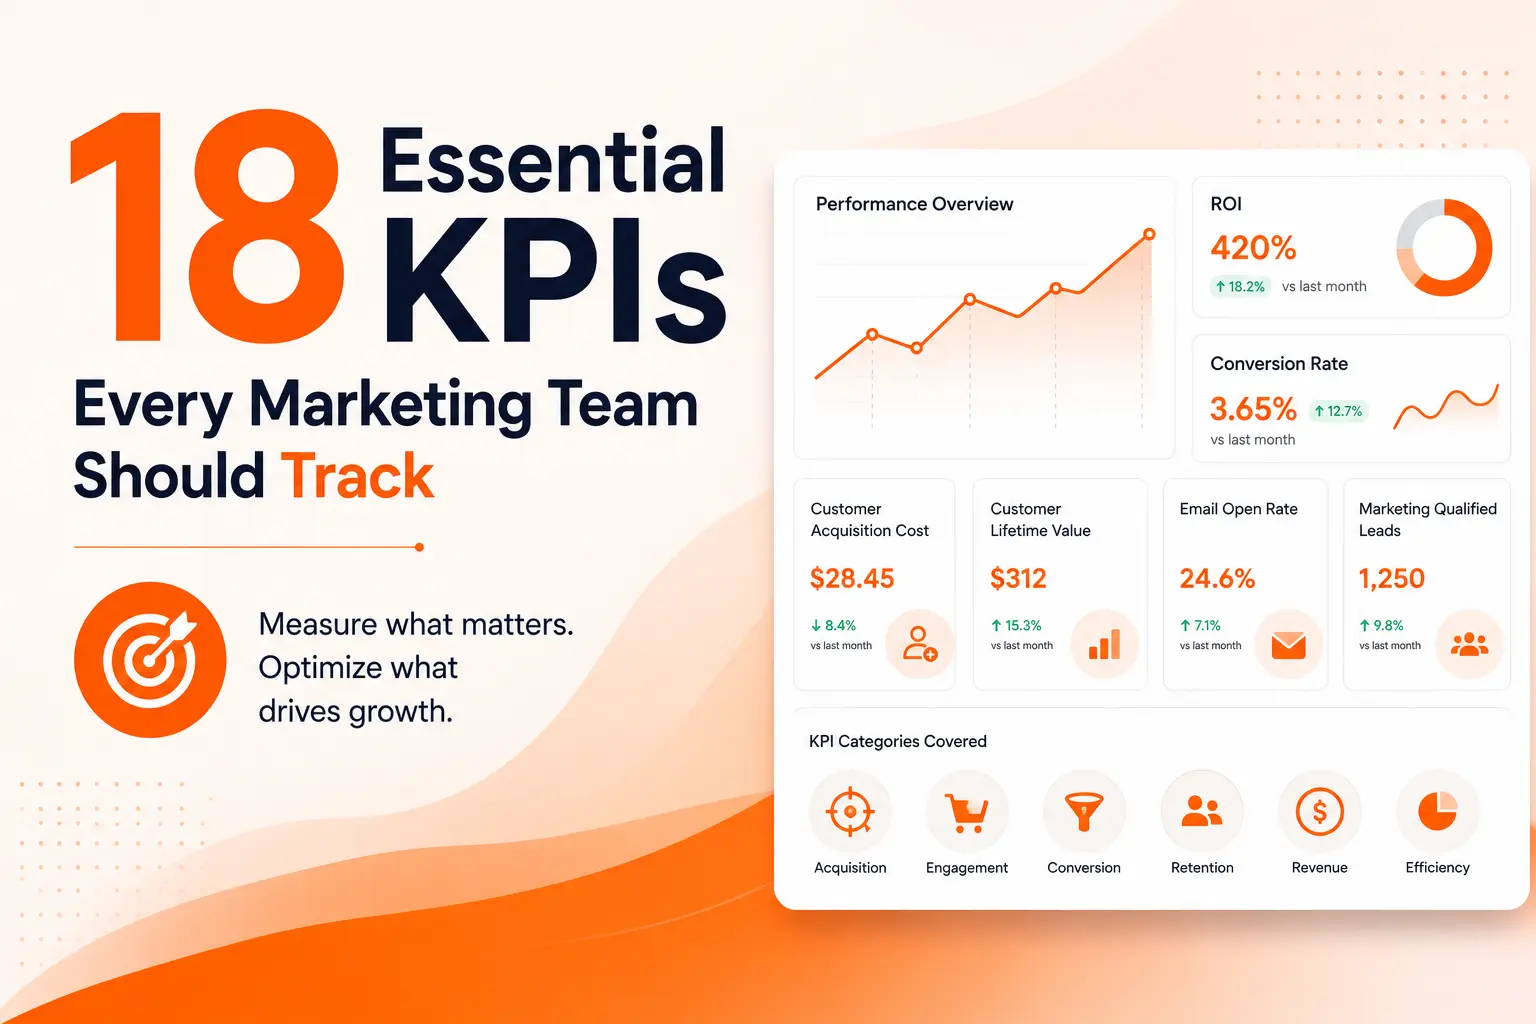
- The 18 essential metrics every marketing team should track
- Best practices for improving journey performance using automation and AI
What Are Customer Journey Metrics?
Customer journey metrics are key performance indicators (KPIs) that measure how customers interact with your brand throughout their lifecycle in a customer journey map.
These metrics span every stage of the customer journey:
- Awareness
- Consideration
- Conversion
- Onboarding
- Retention
- Advocacy
Unlike campaign metrics, which measure the success of a single marketing initiative, journey metrics provide a holistic view of customer behavior across multiple channels and touchpoints.
Campaign Metrics vs. Customer Journey Metrics
| Campaign Metrics | Customer Journey Metrics |
| Email open rate | Welcome journey completion rate |
| Paid ad CTR | Customer acquisition efficiency |
| Landing page conversions | End-to-end conversion rate |
| Social engagement | Customer retention rate |
| Individual campaign ROI | Customer lifetime value |
Journey metrics answer questions like:
- Where are customers dropping off?
- Which journeys generate the highest revenue?
- How long does it take new users to become loyal customers?
- Which touchpoints contribute most to retention?
Why Customer Journey Metrics Matter
Measuring the customer journey enables marketers to move beyond vanity metrics and optimize experiences that drive meaningful business outcomes.
Identify Friction Points
Journey metrics reveal exactly where customers abandon the buying process, making it easier to remove obstacles.
Improve Personalization
Behavioral insights help marketers deliver relevant experiences based on customer intent and preferences.
Increase Marketing Efficiency
Instead of optimizing individual campaigns, teams can improve the entire customer lifecycle.
Boost Customer Retention
Retention-focused metrics help businesses identify churn risks before customers leave.
Connect Marketing to Revenue
Journey metrics provide a clearer link between marketing efforts and business growth by tracking customer value over time.
The 18 Most Important Customer Journey Metrics
Awareness Stage Metrics
The goal at this stage is attracting the right audience.
1. Website Traffic
Measures the number of visitors discovering your brand.
Track:
- Total visitors
- New visitors
- Returning visitors
- Traffic trends
2. Click-Through Rate (CTR)
CTR indicates how effectively your ads, emails, or search listings encourage users to take the next step.
Formula
CTR = Clicks ÷ Impressions × 100
A higher CTR suggests stronger messaging and audience relevance.
3. Cost Per Acquisition (CPA)
CPA measures how much it costs to acquire a new customer.
Lower acquisition costs generally indicate more efficient marketing efforts.
Consideration Stage Metrics
At this stage, prospects evaluate whether your product or service meets their needs.
4. Engagement Rate
Measures how actively users interact with your content.
This may include:
- Email engagement
- Content downloads
- Webinar attendance
- Product page interactions
5. Time on Site
Longer sessions often indicate stronger purchase intent and better content relevance.
However, always evaluate this metric alongside conversions to ensure users aren’t struggling to find information.
6. Lead Conversion Rate
Measures how effectively visitors become qualified leads.
Formula:
Lead Conversion Rate = Leads ÷ Visitors × 100
Conversion Stage Metrics
This stage determines how efficiently prospects become paying customers.
7. Conversion Rate
The percentage of visitors completing a desired action.
Whether it’s purchasing, subscribing, or requesting a demo, conversion rate remains one of the most critical customer journey metrics.
8. Cart Abandonment Rate
For ecommerce brands, abandoned carts often represent the biggest revenue opportunity.
A high abandonment rate may indicate:
- Unexpected costs
- Complex checkout processes
- Poor mobile experience
- Lack of trust
Automated cart recovery journeys can significantly reduce abandonment.
9. Average Order Value (AOV)
Measures the average amount customers spend per transaction.
Increasing AOV through personalized recommendations and cross-selling can improve revenue without increasing acquisition costs.
Onboarding Stage Metrics
Acquiring customers is only the beginning. Successful onboarding determines whether they realize value quickly.
10. Activation Rate
Activation measures the percentage of customers who complete a meaningful first action.
Examples include:
- Completing profile setup
- Making a first purchase
- Using a core feature
- Creating their first campaign
11. Time to First Value (TTFV)
TTFV measures how quickly customers experience the primary benefit of your product.
Reducing this time improves satisfaction and long-term retention.
12. Feature Adoption Rate
Tracks how many customers actively use key features.
Low adoption often signals poor onboarding rather than poor product quality.
Retention Stage Metrics
Long-term growth depends on keeping existing customers engaged.
13. Customer Retention Rate
Retention measures the percentage of customers who continue doing business over a given period.
High retention generally correlates with stronger customer experiences and higher profitability.
14. Churn Rate
The opposite of retention, churn measures customers who stop using your product or purchasing from your business.
Monitoring churn by customer segment helps identify high-risk audiences before they leave.
15. Customer Lifetime Value (CLV)
CLV estimates the total revenue a customer generates throughout their relationship with your business.
It’s one of the most valuable metrics because it connects customer experience directly to revenue.
Increasing CLV typically involves:
- Better onboarding
- Personalized recommendations
- Cross-selling
- Loyalty programs
- Proactive engagement
Advocacy Stage Metrics
Satisfied customers often become your strongest marketing channel.
16. Net Promoter Score (NPS)
NPS measures customer willingness to recommend your brand.
It’s a strong indicator of loyalty and future growth.
17. Referral Rate
Tracks how many new customers are acquired through existing customer referrals.
Higher referral rates typically indicate exceptional customer experiences.
18. Customer Satisfaction (CSAT)
CSAT surveys provide immediate feedback after interactions like purchases, support requests, or onboarding.
Combined with behavioral data, CSAT helps explain why customers remain loyal or leave.
Customer Journey Metrics by Lifecycle Stage
| Journey Stage | Key Metrics |
| Awareness | Website Traffic, CTR, CPA |
| Consideration | Engagement Rate, Time on Site, Lead Conversion Rate |
| Conversion | Conversion Rate, Cart Abandonment, AOV |
| Onboarding | Activation Rate, Time to First Value, Feature Adoption |
| Retention | Retention Rate, Churn Rate, CLV |
| Advocacy | NPS, Referral Rate, CSAT |
KPI-to-Business Outcomes Matrix
| Customer Journey KPI | Revenue | Retention | Engagement | Customer Experience |
| Website Traffic | 🟡 | ⚪ | 🟢 | ⚪ |
| CTR | 🟢 | ⚪ | 🟢 | ⚪ |
| Conversion Rate | 🟢🟢🟢 | 🟡 | 🟢 | 🟡 |
| Average Order Value | 🟢🟢🟢 | 🟡 | ⚪ | ⚪ |
| Activation Rate | 🟢🟢 | 🟢🟢 | 🟢 | 🟢 |
| Customer Retention Rate | 🟢🟢 | 🟢🟢🟢 | 🟡 | 🟢 |
| Churn Rate | 🟢🟢 | 🟢🟢🟢 | ⚪ | 🟢 |
| Customer Lifetime Value | 🟢🟢🟢 | 🟢🟢🟢 | 🟡 | 🟢 |
| NPS | 🟡 | 🟢🟢 | 🟢 | 🟢🟢🟢 |
Legend:
- 🟢 Strong impact
- 🟡 Moderate impact
- ⚪ Limited/direct impact
Best Practices for Measuring Customer Journey Metrics
Once you start using customer journey orchestration platform and optimize your customer journey, you’ll need the right metrics to measure the ROI of your investment.
1. Focus on the Entire Journey
Avoid optimizing isolated campaigns.
Instead, analyze how customers move across channels from acquisition to retention.
2. Connect Data Across Touchpoints
Customers engage through:
- Website
- Mobile apps
- SMS
- Push notifications
- Customer support
Unified customer data provides a complete view of the journey.
3. Prioritize Leading Indicators
Revenue is important, but metrics like activation rate, onboarding completion, and engagement often predict future success.
4. Segment Your Metrics
Measure journey performance by:
- Customer lifecycle stage
- Geography
- Device
- Acquisition source
- Customer value
- Product category
Segmentation uncovers opportunities that aggregate data often hides.
5. Review Metrics Continuously
Customer behavior evolves over time.
Regularly reviewing journey metrics allows teams to adapt personalization strategies and improve customer experiences.
How AI Improves Customer Journey Metrics
Modern customer journey platforms use AI to optimize journeys automatically.
Instead of relying solely on predefined workflows, AI can analyze customer behavior in real time and determine the best next action.
Examples include:
Predictive Personalization
AI recommends products, content, or offers based on customer preferences.
Intelligent Journey Orchestration
Instead of sending messages on fixed schedules, AI determines the optimal timing, channel, and content for each individual.
Churn Prediction
Machine learning identifies customers at risk of leaving, enabling proactive retention campaigns.
Next Best Action
Decisioning Agent evaluates customer behavior and recommends the most relevant interaction to maximize engagement and conversions.
Automated Experimentation
Rather than manually testing every variation, AI continuously optimizes messaging, channels, and journeys based on performance.
The result is a more personalized customer experience and stronger business outcomes across the entire customer lifecycle.
Common Mistakes to Avoid
Many organizations still struggle to measure customer journeys effectively.
Common mistakes include:
- Tracking too many vanity metrics
- Measuring channels instead of journeys
- Ignoring retention metrics
- Failing to connect marketing metrics with revenue
- Using disconnected data sources
- Reviewing performance too infrequently
Avoiding these pitfalls helps teams focus on metrics that genuinely improve customer experience and business growth.
Conclusion
Today’s customers don’t think in terms of channels they think in terms of experiences. That’s why measuring isolated campaign metrics is no longer enough.
Customer journey metrics give marketers a complete view of how customers discover, engage with, purchase from, and stay loyal to a brand. By tracking the right KPIs at every lifecycle stage, businesses can identify friction, personalize interactions, and optimize experiences that drive measurable growth.
As AI-powered journey orchestration becomes the norm, the ability to monitor and improve these metrics in real time will become a key competitive advantage. Organizations that focus on the customer journey not just individual campaigns will be better positioned to increase engagement, improve retention, and maximize customer lifetime value.